It finally happened! In this weeks Matt Parker’s Maths Puzzles (MPMP), the challenge proposed was finally something I had a quick idea for on how to solve it in R.
If you’re unfamiliar with the MPMP series, or specificially the current challenge (posted on June 24th), here’s the video with the puzzle which I won’t embed because tracking and stuff.
The puzzle submission page with some extra info is located here if you want to give it a go, but I’ll restate the goal here:
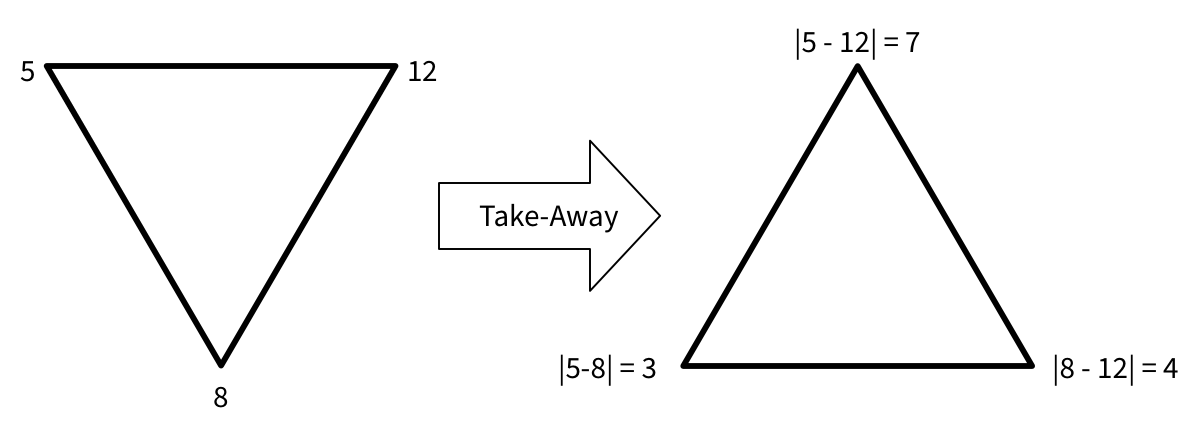
Puzzle for Submission: The puzzle this week is to find three starting numbers for a take-away triangle so that eventually each set of the three new numbers generated always adds to 14.
Well then, time to do some takeaways.
For reproducibility (and since I intend to submit this as “extra working out”), here’s the packages I used:
| |
takeaway(): The Basic Building Block
Link to heading
First up I’ll define a function to do “one round” of takeaway on a set of 3 numbers, e.g. \(X = \{4, 8, 12\}\). I’ll use the first digit as the left corner, the right digit as the right corner, and the middle digit as the centered corner of the triangles (it makes sense if you’ve watched the video I swear), and using R’s vectorization this is fairly easy to implement:
| |
| |
This should implement the following operation:
Once again, money spent on OmniGraffle very well… underutilized.
I’m not too sure about the notation, but I think if I put it like this should be a roughly correct way to formalize the operation:
\begin{align} \operatorname{takeaway}: \mathbb{N}^3 &\to \mathbb{N}^3 \\ \{a,b,c\} &\mapsto \{|a-b|, |a-c|, |b-c|\} \\ \end{align}
…I can’t tell if that’s helping.
Anyway, now I have a function to do “one step”. The next step (heh) is to iteratively do the take-aways for a set number of steps (I chose 50 here) while also starting off with a random set of integers between 1 and 100 (arbitrarily enough).
It turns out this is one of the few cases where you need (I think) a for loop in R, because you need the \(n\)th result to calculate the \(n+1\)th result — but if anyone manages a more functional-progamming-y solution via purrr::map, I’d be curious to see it.
| |
| |
Note that the numbers column is actually a list column containing a vector with the numbers at that step. I could have pasted them together as a string after I got their sum, but oh well — I’ll do that later.
Doing Things A Lot Link to heading
Now that we have a function to generate a random run of 50 steps, we’ll do the classic “computer fast brain slow” approach of “just simulating a bunch” by generating 100 successive runs, each with random starting numbers:
| |
Let’s take a quick look:
| |
| |
Well the first run there did not end up with a sequence of 14’s, but oh well, there’s more to examine.
I fiddled around a bit when I tried to find a reliable solution to identify “winning” runs, i.e. those that ended up with 14’s repeating, but I settled for this condition:
- If the last couple steps (i.e. starting at step 45) are all equal to 14, then it’s a winner.
…writing it down it really does not seem terribly hard to come up with, but putting it in code took me a minute, thankfully good old all() is around.
So, we check each run for this condition, filter the runs that meet this condition, and then extract the run_id, the numeric identifier I gave to each run earlier.
| |
| |
Well then, what where the starting numbers? Did they sum to 14? That would disqualify them.
| |
| winners |
|---|
| 52 + 17 + 94 = 163 |
| 3 + 66 + 80 = 149 |
| 46 + 53 + 74 = 173 |
Neato, 3 winning runs and each of them qualify. So here’s 3 perfectly fine submission for you, for free 1.
Bonus Plot Link to heading
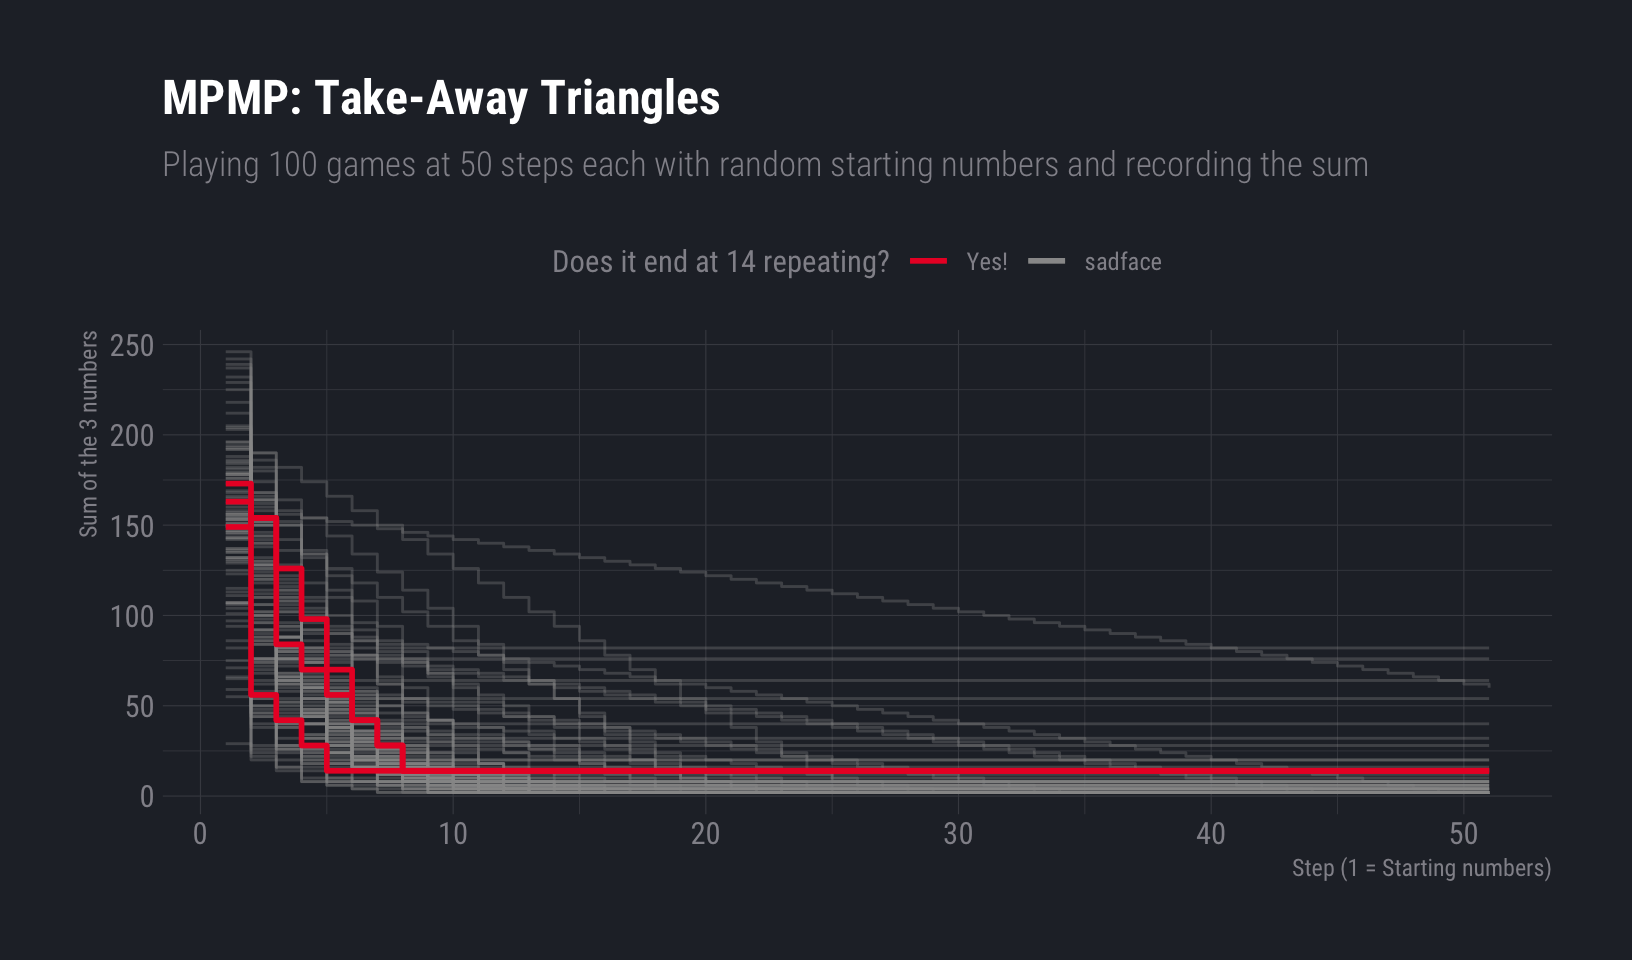
I also couldn’t resist to plot all the runs by their number’s sums at each step, highlighting the 3 winners:
| |
And I think that’s about it?
I’m tempted to try the same approach but with large starting numbers and more steps, but I’ll play around with that later for procrastinative reasons.
But that would be cheating. You monster. ↩︎